
Audience:
Contractors across the construction industry
Most contractors don’t have a clear view of their overall commercial position.
Jobs are running. Numbers are being reported. But there’s no single view showing how everything adds up across the business.
Performance is reviewed in isolation — not as a whole.
👉 And that usually means decisions are made without the full picture.
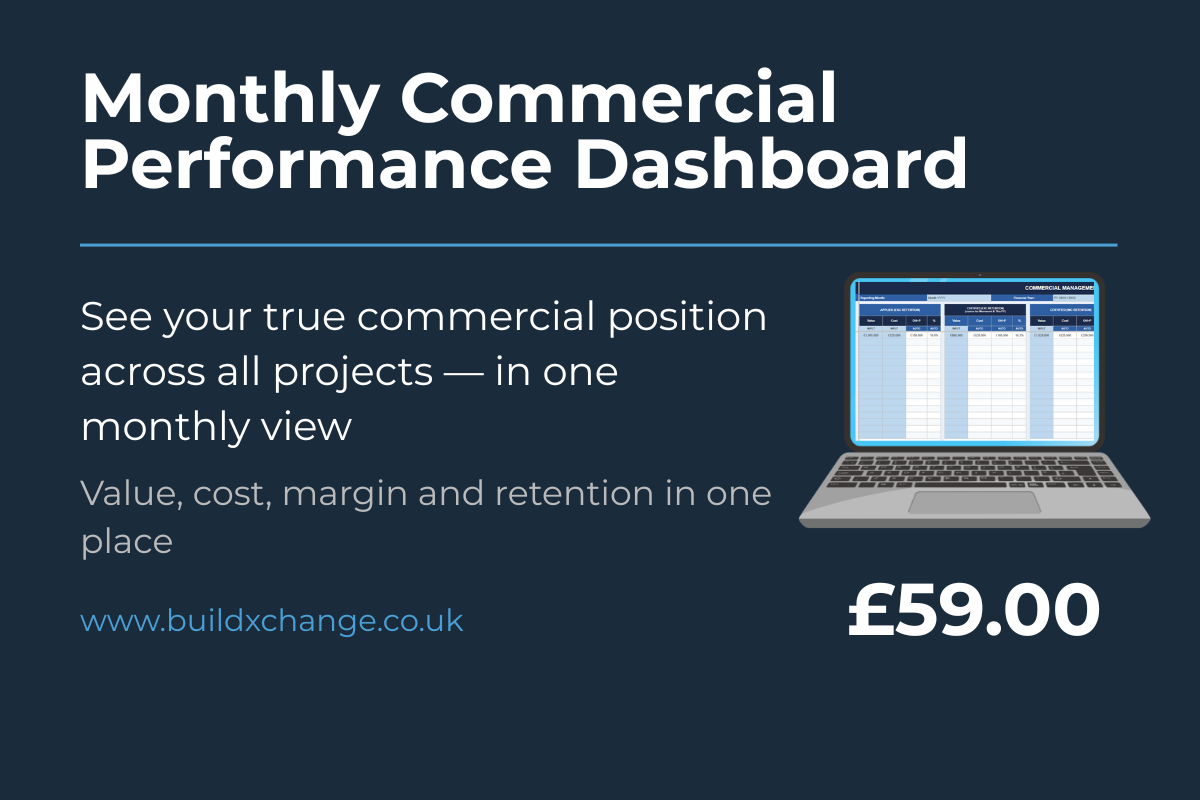
The Monthly Commercial Performance Dashboard gives you a clear, structured view of value, cost, margin, and retention across all live contracts — in one place.
What it does:
Provides a monthly snapshot of commercial performance across multiple projects. Tracks value, cost, margin, retention, and movement to give a clear overall position.
Who it is for:
- Commercial managers overseeing multiple contracts
- QS’s preparing monthly reports
- Directors needing a clear business-wide view
- Contractors lacking a consolidated commercial snapshot
What’s included:
Instructions tab
Full user guide explaining inputs, calculations, and structure
Commercial Summary tab
Tracks multiple jobs in one place including applied and certified value, margin, retention, under-certification, and month-on-month movement
GP Dashboard tab
Client-by-client gross profit summary showing total GP, margin %, job count, and share of overall performance — no input required


